Pivot Highs&lows: Short/Medium/Long-term + Spikeyness FilterShows Pivot Highs & Lows defined or 'Graded' on a fractal basis: Short-term, medium-term and long-term. Also applies 'Spikeyness' condition by default to filter-out weak/rounded pivots
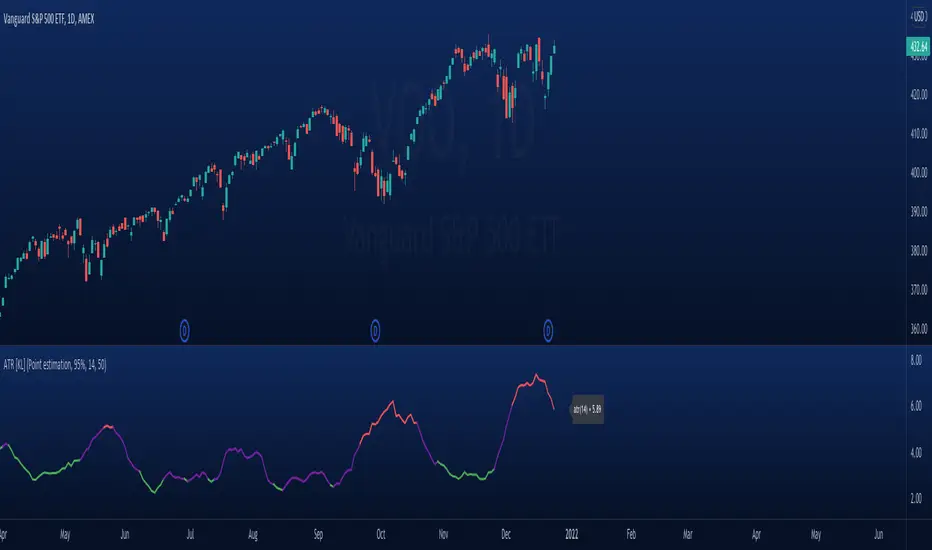
ES1! 4hr chart (CME) shown above, with lookback = 15; clearly identifying the major highs & lows on the basis of how they are fractally 'nested' within lesser Pivots.
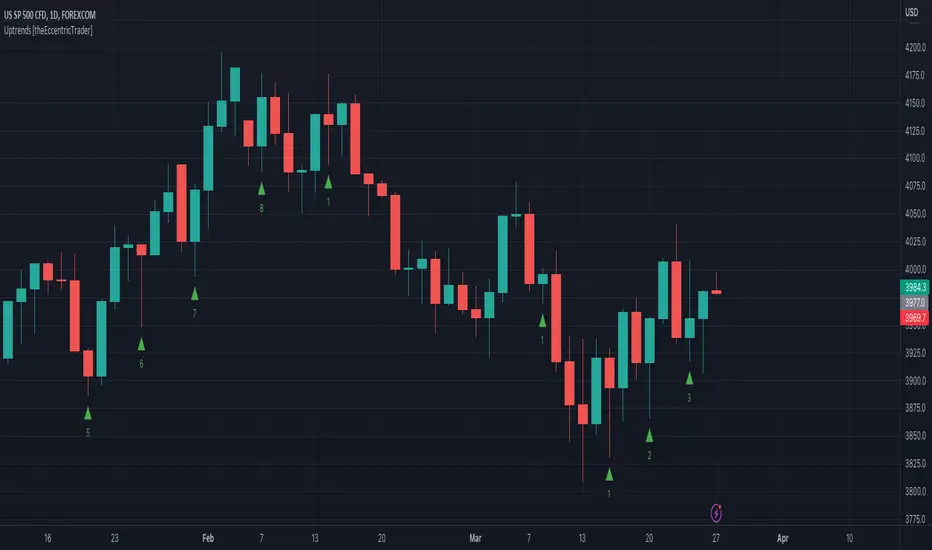
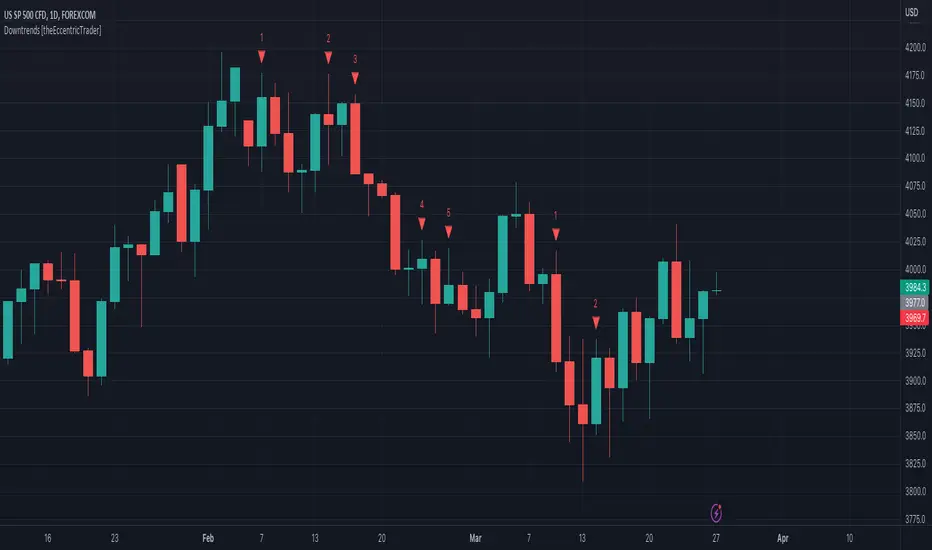
-- in the above chart Short term pivot highs (STH) are simply represented by green 'ʌ', and short-term pivot lows (STL) are simply represented by orange 'v'.
//Basics: (as applying to pivot highs, the following is reversed for pivot lows)
-Short term highs (STH) are simple pivot highs, albeit refined from standard with the 'spikeyness' filter.
-Medium-term highs (MTH) are defined as having a lower STH on either side of them.
-Long-term highs (LTH) are defined as having a lower MTH on either side of them.
//Purpose:
-Education: Quick and easy visualization of the strength or importance of a pivot high or low; a way of grading them based on their larger context.
-Backtesting: use in combination with other trading methods when backtesting to see the relative significance and price sensitivity of LTHs/LTLs compared to lower grade highs and lows.
//Settings:
-Choose Pivot lookback/lookforward bars: One setting, the basis from which all further pivot calculations are done.
-Toggle on/off 'Spikeyness' condition to filter-out weak/rounded/unimpressive pivot highs or lows (default is ON).
-Toggle on/off each of STH, MTH, LTH, STL, MTL, LTL; and choose label text-styles/colors/sizes independently.
-Set text Vertically, horizonally, or simply use 'ʌ' or 'v' symbols if you want to declutter your chart.
//Usage notes:
-Pivots take time to print (lookback bars must have elapsed before confirmation). Fractally nested pivots as here (i.e. a LTH), take even longer to print/confirm, so please be patient.
-Works across timeframes & Assets. Different timeframes may require slightly tweaked lookback/forward settings for optimal use; default is 15 bars.
Example usage with just symbolic labels short-term, med-term, long-term with 1x, 2x and 3x ʌ/v respectively:
Pine Script® göstergesi